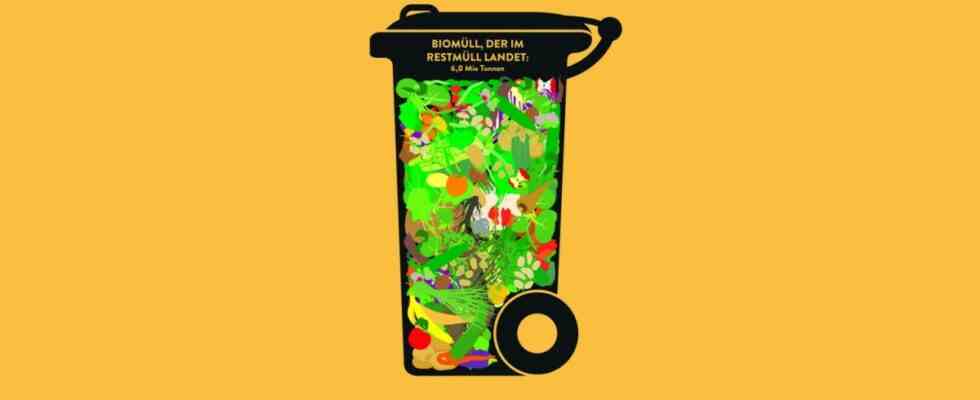
Everyone is talking about the climate. From the suffering environment. About e-cars, CO₂ values and the advantages of cycling. But if you ask how much organic waste really ends up in the organic waste bin (not even half of the approximately 10.5 million tons of compostable annual waste), which milk uses the most water in production (rice drink and almond milk), how much plastic waste in the ocean swims (150 million tons of waste = 6122 plastic cups per capita), the imagination quickly reaches its limit. Numbers are of little use to us, because they are gigantic, intangible values. But Ole Häntzschel (graphics) and Matthias Stolz (text) manage to illustrate this in their book “How much rain forest fits on this bread”?
What the team of authors came up with to make this crisis of our time visible is ingenious and extremely complex in terms of preparatory work and execution. As the subtitle “Amazing Graphics on Climate and Environment” already suggests, 51 infographics examine the climate and environment figures.
A sneaker is examined according to its CO₂ content and broken down into colored intersections.
How does that look in the book? A double page each shows a graphically processed topic such as: What happens when a child is taken to school in an SUV. Häntzschel and Stolz make this tangible by comparing horsepower and child power. One SUV = 340 horses = 4080 children. In fact, you see a tiny little red car dividing the spread with the appropriate number of black, brown and gray horse and colorful children symbols. You don’t need a single explanatory sentence to understand! A sneaker is examined according to its CO₂ content and broken down into colored intersections. A precisely structured graphic visualizes how little environmentally friendly cars are – not excluding the e-variant! Another page demonstrates an environmentally appropriate and at the same time healthy diet plan (including 87 delicious gummy bears). And, the answer to the title riddle: It takes almost exactly the same area as a palm oil plantation to spread 20 grams of nut nougat cream on toast, in other words: jungle clearing and monoculture. The pages are self-explanatory and mostly self-explanatory, 80 percent of the statistics are based on official surveys, and 20 percent are self-calculated. One leafs through in amazement, sees Trump’s environmental sins, listed one after the other in colored capital letters, forming a likeness of the ex-president. The artfully constructed infographics and the little text go hand in hand in this book, which needs no instructions, is not a textbook, does not raise a moral finger and yet makes it clear that it is less than “five to twelve” to act. (from 11 years)
Ole Häntzschel / Matthias Stolz: How much rain forest fits on this bread? Amazing graphics about climate and environment. Tessloff, 2021. 96 pages, 19.95 euros.