A comparison between the Bitcoin market cycles indicates that institutional investment has increased in the current cycle of 2021, unlike the cycle of 2017. This analysis takes a closer look at Bitcoin’s structural market indicators and compares the cycles. Present and year 2017
Bitcoin NVT
NVT assesses the network’s value using the volume of investors in the network. Crypto analyst Willy Woo introduced the model, where the NVT price is calculated by multiplying the on-chain volume by the 2-year median NVT-Ratio (market cap / total network transfer volume).
Back in 2018, after hitting the cyclical peak, both the 30-day MA and the 90-day NVT price have continued to decline for almost 12 months. However, due to the 50% drop that occurred in May 2021, moving These averages have therefore risen to levels above the previous high of 64K.
This change in NVT-based pricing results can translate to higher institutional activity levels compared to retail.
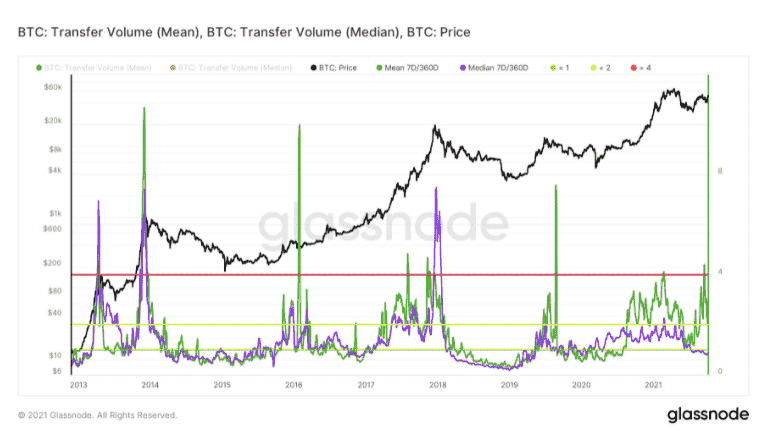
In the past, in every market cycle Historically, both the 7-day MA of on-chain transfer volume Mean & Median has risen to 4X of the 360-day MA level and then dropped below 1X 360-day MA.
The average and median amount of network transfers is a proxy for large and small transactions. when the average increases This means that larger volume transactions occur more often. On the other hand, the median size is representative for smaller transactions made by individual users.
Surprisingly, there is no increase above 4X. In addition, the mean is always correlated with the median. This means that the activity level for both large entities and individual users grows with a rise in prices to a new high of 4 times the 360-day MA.
while the median and mean There are significant differences. This distinction also points to the footprints of large entities in this ecosystem with different beliefs and visions.
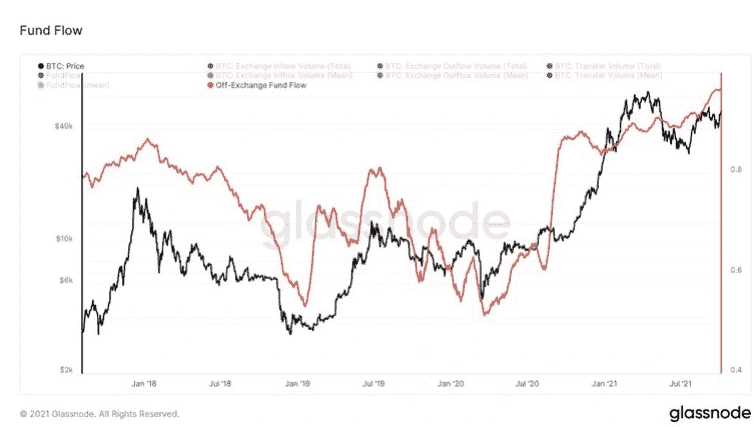
from the above information Another valuable on-chain metric, called the Fund Flow Ratio, can be studied to assess this assumption.
Most of the academy players Transfer their assets from the exchange (on-chain), so we can track the weight of the category by measuring the Fund Flow Ratio (the amount of network transfer volume that is not sent/withdrawn from the exchange. divided by the total network transfer volume). Studies of historical trends of this ratio provide evidence that There will be a later decline after the price reaches ATH and enters a bear market.
However, this ratio has increased since January 2021. Despite a market correction of over 50% in May, almost 96% of on-chain transactions were not due to exchange withdrawals/deposits. Crypto market institutions are on the rise.