Interactive
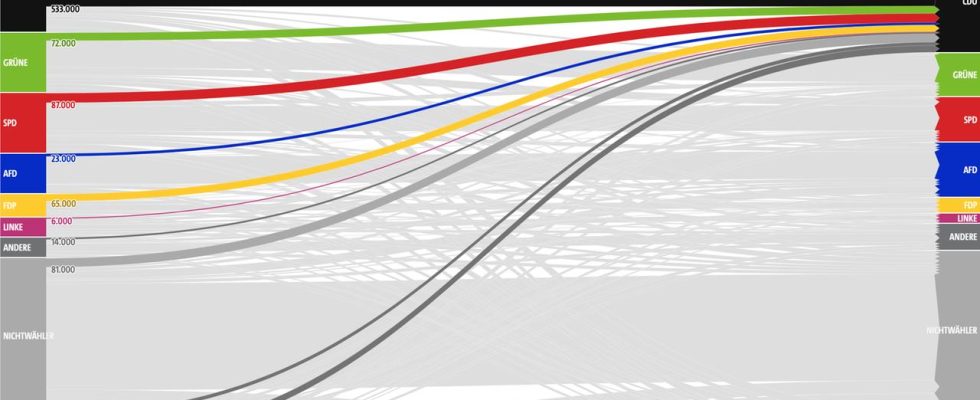
Who gained voters from whom? Who benefited most from losses suffered by other parties? To whom did parties lose former supporters? The interactive map of the preliminary voter migration in the state elections in Hesse.
hints about Voter migration
The migration model from infratest dimap estimates the extent of migration flows. The model takes into account survey results on current and previous voting decisions and estimates voter migration flows between the parties or “retention rates” for the identical party choice. It also takes into account changes in the composition of voters as a result of current and previous non-voters as well as due to generational and location changes (first-time voters versus deceased voters or incoming versus outgoing voters).
An electricity account is calculated for each party with the profits and losses between the parties, the interplay between voter participation and abstention and the change of generation or location. The assumptions about the size and voting behavior of the identified groups are based on representative election and population statistics, pre-election surveys, the exit poll and the official election results. The key results are the estimated balances for the exchange between the parties and with the non-voter camp.
For reasons of transparency, auxiliary estimates for the respective inflows and outflows as well as for people moving in and out are also published. In voter migration, absolute numbers are used instead of percentages in order to better clarify relationships. When interpreting it, it should be taken into account that 1,000 eligible voters represents significantly less than one per thousand of all eligible voters. The individual flows are rounded so that there may be differences in the marginal totals compared to the official result.
The estimate of migration flows changes several times over the course of the election evening (intermediate results), because initially the representative surveys and later increasingly the counting results and finally the result of the preliminary counting are included in the figures shown. After the preliminary results are published, a final estimate will be made and published.