
Google Search Console is an essential tool that offers critical insights into your website’s performance in Google search results.
Occasionally, you might observe a sudden decline in organic traffic, and it’s crucial to understand the potential causes behind this drop. The data stored within Google Search Console (GSC) can be vital in troubleshooting and understanding what has happened to your website.
Before troubleshooting GSC traffic declines, it’s important to understand first what Google says about assessing traffic graphs in GSC and how it reports on different metrics.
Understanding Google Search Console Metrics
Google’s documentation on debugging Search traffic drops is relatively comprehensive (compared to the guidance given in other areas) and can, for the most part, help prevent any immediate or unnecessary panic should there be a change in data.
Despite this, I often find that Search Console data is misunderstood by both clients and those in the first few years of SEO and learning the craft.
Even with these definitions, if your clicks and impressions graphs begin to resemble any of the above graph examples, there can be wider meanings.
| Search Central description | It could also be a sign that… |
| Large drop from an algorithmic update, site-wide security, or spam issue | This could also signal a serious technical issue, such as accidentally deploying a noindex onto a URL or returning the incorrect status code – I’ve seen it before where the URL renders content but returns a 410. |
| Seasonality | You will know your seasonality better than anyone, but if this graph looks inverse it could be a sign that during peak search times, Google is rotating the search engine results pages (SERPs) and choosing not to rank your site highly. This could be because, during peak search periods, there is a slight intent shift in the queries’ dominant interpretation. |
| Technical issues across your site, changing interests | This type of graph could also represent seasonality (both as a gradual decline or increase). |
| Reporting glitch ¯\_(ツ)_/¯ | This graph can represent intermittent technical issues as well as reporting glitches. Similar to the alternate reasons for graphs like Seasonality, it could represent a short-term shift in the SERPs and what meets the needs of an adjusted dominant interpretation of a query. |
Clicks & Impressions
Google filters Click and Impression data in Google Search Console through a combination of technical methods and policies designed to ensure the accuracy, reliability, and integrity of the reported data.
Reasons for this include:
- Spam and bot filtering.
- Duplicate data removal.
- User privacy/protection.
- Removing “invalid activities.”
- Data aggregation and sampling.
One of the main reasons I’ve seen GSC change the numbers showing the UI and API is down to the setting of thresholds.
Google may set thresholds for including data in reports to prevent skewed metrics due to very low-frequency queries or impressions. For example, data for queries that result in very few impressions might be excluded from reports to maintain the statistical reliability of the metrics.
Average Position
Google Search Console produces the Average Position metric by calculating the average ranking of a website’s URLs for a specific query or set of queries over a defined period of time.
Each time a URL appears in the search results for a query, its position is recorded. For instance, if a URL appears in the 3rd position for one query and in the 7th position for another query, these positions are logged separately.
As we enter the era of AI Overviews, John Mueller has confirmed via Slack conversations that appearing in a generative snapshot will affect the average position of the query and/or URL in the Search Console UI.
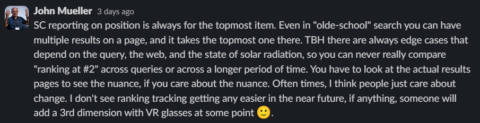 Source: John Mueller via The SEO Community Slack channel
I don’t rely on the average position metric in GSC for rank tracking, but it can be useful in trying to debug whether or not Google is having issues establishing a single dominant page for specific queries.
Understanding how the tool compiles data allows you to better diagnose the reasons as to why, and correlate data with other events such as Google updates or development deployments.
Google Updates
A Google broad core algorithm update is a significant change to Google’s search algorithm intended to improve the relevance and quality of search results.
These updates do not target specific sites or types of content but alter specific systems that make up the “core” to an extent it is noteworthy for Google to announce that an update is happening.
Google makes updates to the various individual systems all the time, so the lack of a Google announcement does not disqualify a Google update from being the cause of a change in traffic.
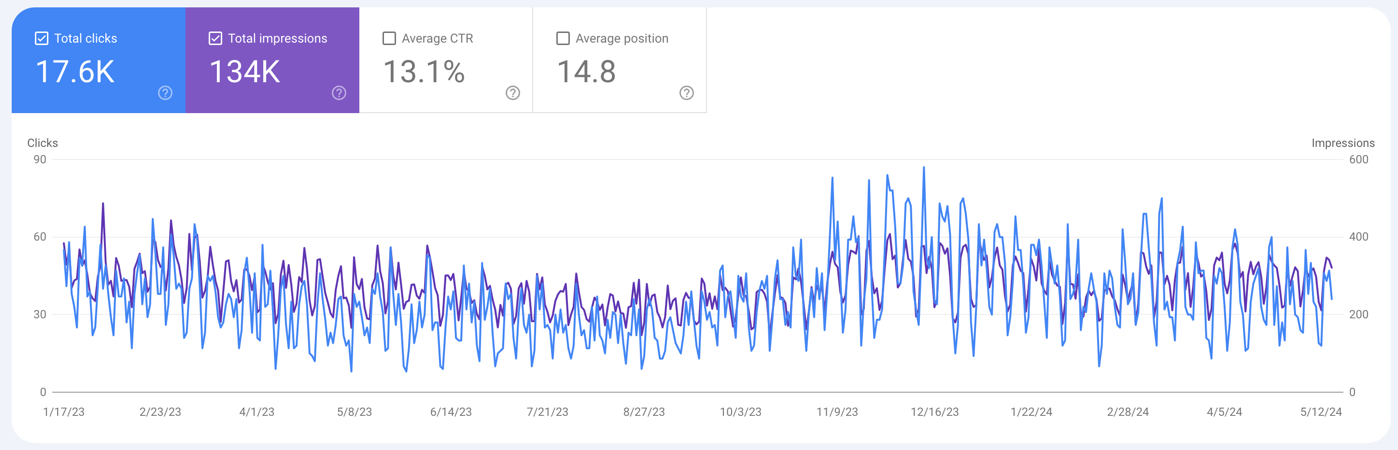
For example, the website in the below screenshot saw a decline from the March 2023 core update but then recovered in the November 2023 core update.
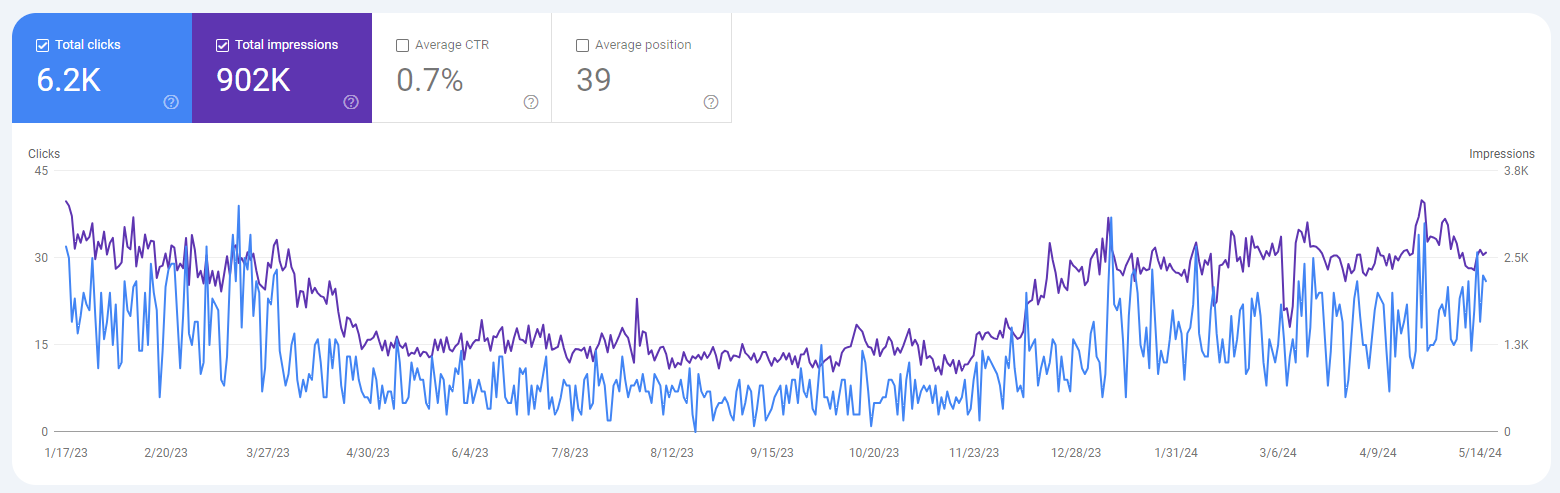 Screenshot by author from Google Search Console, May 2024
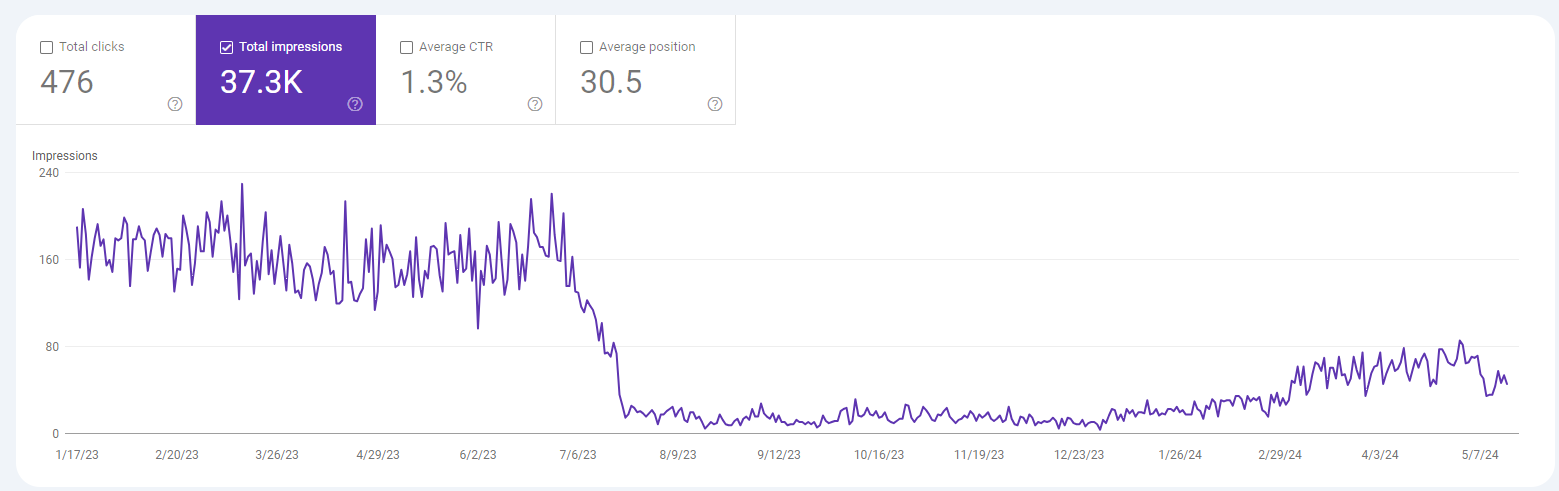
The following screenshot shows another example of a traffic decline correlating with a Google update, and it also shows that recovery doesn’t always occur with future updates.
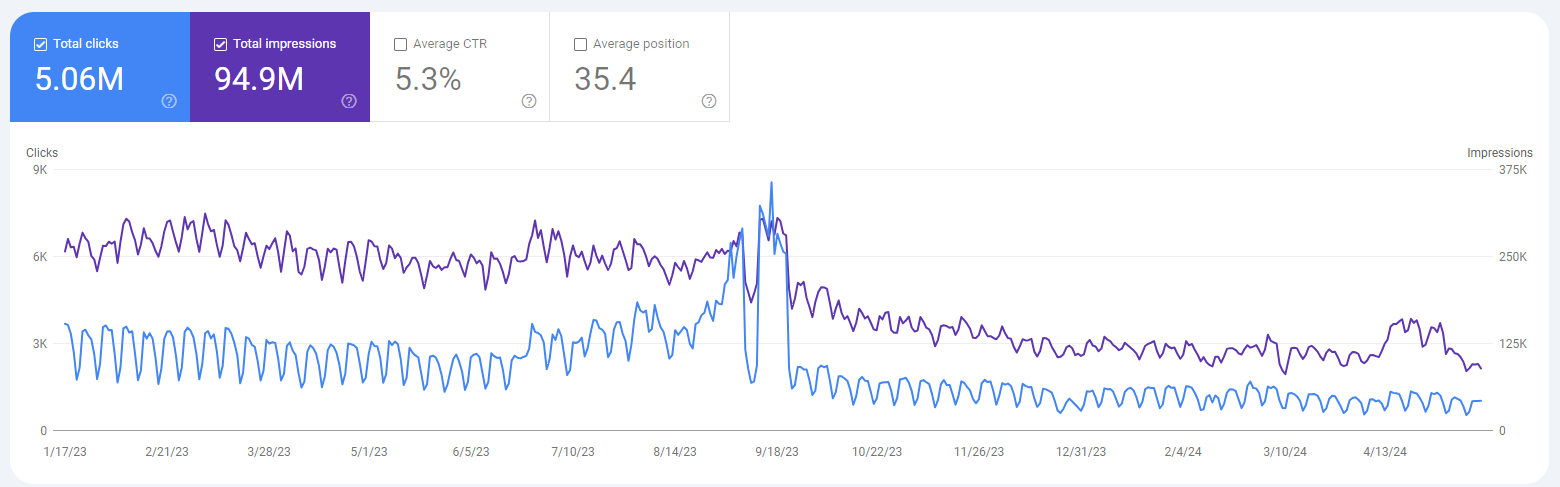 Screenshot by author from Google Search Console, May 2024
This site is predominantly informational content supporting a handful of marketing landing pages (a traditional SaaS model) and has seen a steady decline correlating with the September 2023 helpful content update.
How To Fix This
Websites negatively impacted by a broad core update can’t fix specific issues to recover.
Webmasters should focus on providing the best possible content and improving overall site quality.
Recovery, however, may occur when the next broad core update is rolled out if the site has improved in quality and relevance or Google adjusts specific systems and signal weightings back in the favour of your site.
In SEO terminology, we also refer to these traffic changes as an algorithmic penalty, which can take time to recover from.
SERP Layout Updates
Given the launch of AI Overviews, I feel many SEO professionals will conduct this type of analysis in the coming months.
In addition to AI Overviews, Google can choose to include a number of different SERP features ranging from:
- Shopping results.
- Map Packs.
- X (Twitter) carousels.
- People Also Ask accordions.
- Featured snippets.
- Video thumbnails.
All of these not only detract and distract users from the traditional organic results, but they also cause pixel shifts.
From our testing of SGE/AI Overviews, we see traditional results being pushed down anywhere between 1,000 and 1,500 pixels.
When this happens you’re not likely to see third-party rank tracking tools show a decrease, but you will see clicks decline in GSC.
The impact of SERP features on your traffic depends on two things:
- The type of feature introduced.
- Whether your users predominantly use mobile or desktop.
Generally, SERP features are more impactful to mobile traffic as they greatly increase scroll depth, and the user screen is much smaller.
You can establish your dominant traffic source by looking at the device breakdown in Google Search Console:
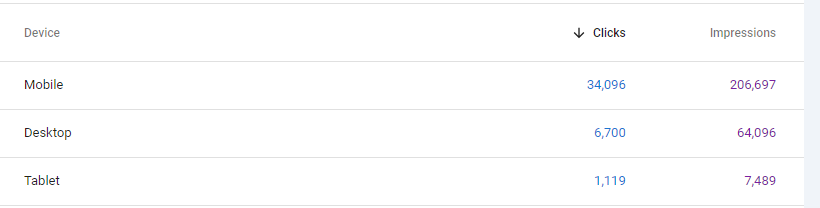 Image from author’s website, May 2024
You can then compare the two graphs in the UI, or by exporting data via the API with it broken down by devices.
How To Fix This
When Google introduces new SERP features, you can adjust your content and site to become “more eligible” for them.
Some are driven by structured data, and others are determined by Google systems after processing your content.
If Google has introduced a feature that results in more zero-click searches for a particular query, you need to first quantify the traffic loss and then adjust your strategy to become more visible for similar and associated queries that still feature in your target audience’s overall search journey.
Seasonality Traffic Changes
Seasonality in demand refers to predictable fluctuations in consumer interest and purchasing behavior that occur at specific times of the year, influenced by factors such as holidays, weather changes, and cultural events.
Notably, a lot of ecommerce businesses will see peaks in the run-up to Christmas and Thanksgiving, whilst travel companies will see seasonality peaks at different times of the year depending on the destinations and vacation types they cater to.
The below screenshot is atypical of a business that has a seasonal peak in the run-up to Christmas.
 Screenshot by author from Google Search Console, May 2024
You will see these trends in the Performance Report section and likely see users and sessions mirrored in other analytics platforms.
During a seasonal peak, Google may choose to alter the SERPs in terms of which websites are ranked and which SERP features appear. This occurs when the increase in search demand also brings with it a change in user intent, thus changing the dominant interpretation of the query.
In the travel sector, the shift is often from a research objective to a commercial objective. Out-of-season searchers are predominantly researching destinations or looking for deals, and when it is time to book, they’re using the same search queries but looking to book.
As a result, webpages with a value proposition that caters more to the informational intent are either “demoted” in rankings or swapped out in favor of webpages that (in Google’s eyes) better cater to users in satisfying the commercial intent.
How To Fix This
There is no direct fix for traffic increases and decreases caused by seasonality.
However, you can adjust your overall SEO strategy to accommodate this and work to create visibility for the website outside of peak times by creating content to meet the needs and intent of users who may have a more research and information-gathering intent.
Penalties & Manual Actions
A Google penalty is a punitive action taken against a website by Google, reducing its search rankings or removing it from search results, typically due to violations of Google’s guidelines.
As well as receiving a notification in GSC, you’ll typically see a sharp decrease in traffic, akin to the graph below:
 Screenshot by author from Google Search Console, May 2024
Whether or not the penalty is partial or sitewide will depend on how bad the traffic decline is, and also the type (or reason) as to why you received a penalty in the first place will determine what efforts are required and how long it will take to recover.
Changes In PPC Strategies
A common issue I encounter working with organizations is a disconnect in understanding that, sometimes, altering a PPC campaign can affect organic traffic.
An example of this is brand. If you start running a paid search campaign on your brand, you can often expect to see a decrease in branded clicks and CTR. As most organizations have separate vendors for this, it isn’t often communicated that this will be the case.
The Search results performance report in GSC can help you identify whether or not you have cannibalization between your SEO and PPC. From this report, you can correlate branded and non-branded traffic drops with the changelog from those in command of the PPC campaign.
How To Fix This
Ensuring that all stakeholders understand why there have been changes to organic traffic, and that the traffic (and user) isn’t lost, it is now being attributed to Paid.
Understanding if this is the “right decision” or not requires a conversation with those managing the PPC campaigns, and if they are performing and providing a strong ROAS, then the organic traffic loss needs to be acknowledged and accepted.
Recovering Site Traffic
Recovering from Google updates can take time.
Recently, John Mueller has said that sometimes, to recover, you need to wait for another update cycle.
However, this doesn’t mean you shouldn’t be active in trying to improve your website and better align with what Google wants to reward and relying on Google reversing previous signal weighting changes.
It’s critical that you start doing all the right things as soon as possible. The earlier that you identify and begin to solve problems, the earlier that you open up the potential for recovery. The time it takes to recover depends on what caused the drop in the first place, and there might be multiple factors to account for. Building a better website for your audience that provides them with better experiences and better service is always the right thing to do.
More resources:
Featured Image: Ground Picture/Shutterstock